Serverless analytics offers a powerful paradigm shift, enabling scalable and cost-effective data processing without the burden of server management. However, realizing the full potential of serverless analytics hinges on meticulous performance optimization. This involves understanding the unique characteristics of serverless environments and addressing potential bottlenecks that can impact both processing speed and operational costs.
This guide delves into the core principles and practical techniques for maximizing the efficiency of serverless analytics workloads. From selecting the right architecture and optimizing data storage to fine-tuning code and managing concurrency, we will explore a range of strategies designed to ensure optimal performance and cost-effectiveness in your serverless analytics implementations. This comprehensive overview will equip you with the knowledge to build robust, scalable, and high-performing analytics solutions.
Introduction to Serverless Analytics Performance Optimization
Serverless analytics represents a paradigm shift in data processing, offering significant advantages in terms of scalability, cost-effectiveness, and operational efficiency. This approach leverages cloud-based services to automatically manage infrastructure, allowing data engineers and analysts to focus on data insights rather than server administration. However, the inherent characteristics of serverless architectures, such as function cold starts and resource limitations, can introduce performance bottlenecks that need careful consideration.Optimizing performance in serverless analytics is crucial for both minimizing costs and delivering a responsive user experience.
Efficient resource utilization directly translates to reduced operational expenses, while faster query execution and data processing contribute to improved application responsiveness and user satisfaction. Neglecting performance optimization can lead to significant cost overruns and a degraded user experience, hindering the potential benefits of the serverless model.
Common Performance Bottlenecks
Several factors can impede performance in serverless analytics environments. Understanding these bottlenecks is essential for implementing effective optimization strategies.
- Cold Starts: The time it takes for a serverless function to initialize when it hasn’t been used recently. This delay can significantly impact query latency, especially for interactive dashboards or real-time analytics applications. The cold start process involves several steps:
- Loading the function code and dependencies.
- Initializing the execution environment.
- Establishing connections to data sources.
- Memory Limits: Serverless functions have defined memory limits. Exceeding these limits can lead to function failures or performance degradation due to increased garbage collection overhead. Careful consideration must be given to the memory requirements of data processing tasks, such as data transformations and aggregations.
- Network Latency: Data transfer between serverless functions, data storage, and external services can introduce latency. This is particularly relevant when dealing with large datasets or geographically distributed resources. The choice of data storage and the network configuration can greatly influence the impact of network latency.
- Data Serialization and Deserialization: The process of converting data into a format suitable for transmission (serialization) and converting it back (deserialization) can consume significant processing time, especially for complex data structures. Efficient serialization formats and techniques can mitigate this bottleneck.
- Resource Allocation and Scaling: Serverless platforms automatically scale resources based on demand, but there can be delays in provisioning resources, which can affect performance. Understanding the scaling behavior of the underlying platform and configuring functions appropriately are crucial for optimal performance.
Importance of Optimizing for Cost Efficiency and User Experience
Optimizing serverless analytics performance directly impacts both cost efficiency and user experience, creating a virtuous cycle of improvement.
- Cost Efficiency: Serverless computing models are based on a pay-per-use model. Faster function execution, reduced memory consumption, and efficient data transfer translate directly to lower costs. Optimizing for cost efficiency involves:
- Right-sizing functions to match resource requirements.
- Minimizing cold start times.
- Optimizing data access patterns.
- Choosing cost-effective storage and compute options.
- User Experience: Fast query execution and responsive dashboards are critical for user satisfaction. Performance optimization directly contributes to a positive user experience by:
- Reducing query latency.
- Enabling real-time or near-real-time analytics.
- Improving the responsiveness of data-driven applications.
Choosing the Right Serverless Architecture
Selecting the appropriate serverless architecture is paramount for optimizing performance in analytics workloads. This decision significantly impacts scalability, cost, and the overall efficiency of data processing. Careful consideration of various factors, including compute options and platform-specific characteristics, is crucial for achieving optimal results.
Comparing Serverless Compute Options for Analytics Workloads
Different serverless compute options offer distinct advantages and disadvantages for analytics applications. The choice depends on the specific requirements of the workload, such as the processing intensity, latency requirements, and cost constraints.AWS Lambda, Azure Functions, and Google Cloud Functions are the leading serverless compute platforms. Each platform has its own strengths and weaknesses regarding performance, cost, and ease of use.
- AWS Lambda: AWS Lambda is a widely adopted serverless compute service that supports multiple programming languages and offers extensive integration with other AWS services. Its strengths lie in its mature ecosystem, robust scalability, and rich feature set. Lambda is well-suited for event-driven analytics pipelines, data transformation tasks, and batch processing. However, cold starts can be a concern for latency-sensitive applications.
AWS Lambda offers various memory and CPU configurations, allowing users to optimize for performance and cost. For example, a function configured with more memory will receive more CPU resources, leading to faster execution times.
- Azure Functions: Azure Functions, the serverless compute service offered by Microsoft Azure, provides a similar feature set to AWS Lambda, including support for multiple languages and event triggers. It offers strong integration with other Azure services, such as Azure Blob Storage and Azure Cosmos DB. Azure Functions can be a compelling choice for organizations already invested in the Microsoft ecosystem. The pricing model is competitive, and the platform offers good support for various data processing scenarios.
- Google Cloud Functions: Google Cloud Functions, built on Google Cloud Platform (GCP), provides a serverless compute environment with seamless integration with other GCP services like BigQuery and Cloud Storage. It supports various programming languages and offers excellent performance, especially for tasks that benefit from Google’s global network. Cloud Functions are well-suited for real-time data processing, API backends, and data transformation tasks. Google’s infrastructure often leads to reduced cold start times compared to other platforms.
Identifying Factors for Selecting a Serverless Platform Based on Performance Needs
Several factors influence the selection of a serverless platform, with performance requirements being a key driver. These factors include cold start times, execution duration limits, memory and CPU allocation, network performance, and the availability of specific features relevant to analytics workloads.
- Cold Start Time: Cold start time is the latency incurred when a serverless function is invoked for the first time or after a period of inactivity. Shorter cold start times are crucial for applications requiring low latency, such as real-time dashboards or interactive analytics applications. Platforms like Google Cloud Functions often exhibit faster cold start times.
- Execution Duration Limits: Serverless platforms impose limits on the maximum execution time of a function. Analytics workloads that involve long-running computations or large datasets need to be designed to operate within these limits. AWS Lambda allows for function durations up to 15 minutes, while Azure Functions and Google Cloud Functions also have their respective limits. Consider breaking down large tasks into smaller, independent functions if execution time is a constraint.
- Memory and CPU Allocation: Serverless platforms allow users to configure the memory allocated to a function, which indirectly affects the CPU resources available. Functions with higher memory allocations often benefit from increased CPU power, leading to faster execution times. Optimizing memory allocation is essential for balancing performance and cost.
- Network Performance: The network performance between the serverless function and data sources or destinations is crucial for analytics workloads. Platforms with lower network latency and higher bandwidth can significantly improve data transfer speeds. Consider deploying functions in regions geographically close to data sources to minimize network latency.
- Integration with Other Services: The ease of integration with other services within the chosen cloud provider’s ecosystem can also affect performance. For example, tight integration with a data warehouse like BigQuery (GCP) or a data lake like S3 (AWS) can improve data ingestion and processing efficiency.
Designing a Decision Tree to Choose the Most Suitable Serverless Architecture
A decision tree can help users systematically evaluate different serverless architectures based on their specific requirements. The decision tree guides users through a series of questions, ultimately leading to the most appropriate platform and configuration.
The decision tree could start with these questions:
- Is low latency critical? If yes, prioritize platforms with faster cold start times (e.g., Google Cloud Functions). If no, cold start time is less of a concern.
- What is the maximum execution time required? Determine if long-running tasks are needed. If yes, check the platform’s execution time limits and consider architectural changes (e.g., breaking down tasks). If no, execution time limits are less of a concern.
- What is the budget constraint? Compare the cost models of different platforms, considering factors like request volume, execution time, and memory usage.
- Which cloud provider ecosystem is preferred? Consider existing infrastructure, familiarity with the platform, and integration with other services.
The decision tree guides the user through these and other questions, leading to a recommendation for a specific serverless platform and configuration based on the answers provided. For example:
If low latency is critical and the preferred cloud provider is AWS, then AWS Lambda with optimized memory and CPU configuration is recommended.
Data Storage and Retrieval Optimization
Optimizing data storage and retrieval is critical for achieving high performance in serverless analytics. Efficiently managing data storage and retrieval directly impacts query latency, cost, and overall system scalability. Strategies in this area involve careful consideration of data formats, storage options, and retrieval mechanisms to minimize bottlenecks and maximize resource utilization.
Data Partitioning and Compression Strategies
Data partitioning and compression are essential techniques for optimizing data storage in serverless analytics environments. Partitioning organizes data logically, enabling faster data access by reducing the amount of data that needs to be scanned during queries. Compression reduces storage costs and improves query performance by decreasing the amount of data that needs to be transferred and processed.
- Data Partitioning: Partitioning divides data into smaller, manageable chunks based on specific criteria, such as time (e.g., daily, weekly, monthly), geography, or customer segments. This allows queries to target only the relevant partitions, significantly reducing the data volume processed. For example, consider an e-commerce platform analyzing sales data. Partitioning by date enables queries like “show me sales for last week” to scan only the weekly partition, rather than the entire dataset.
Common partitioning strategies include:
- Time-based Partitioning: Partitioning data by time periods (e.g., year, month, day).
- Key-based Partitioning: Partitioning data based on a specific key, such as customer ID or product category.
- Geographic Partitioning: Partitioning data based on geographic regions.
- Data Compression: Compressing data reduces its size, leading to lower storage costs and faster data retrieval. Compression algorithms trade off CPU cycles for storage space; the choice of algorithm depends on the specific data characteristics and performance requirements. Popular compression algorithms for analytical workloads include:
- Gzip: A widely used, general-purpose compression algorithm.
- Snappy: Designed for high-speed compression and decompression.
- Parquet: A columnar storage format that incorporates compression, optimized for analytical queries.
- Example: An application using AWS S3 for storing clickstream data. Partitioning by day and compressing the data using Gzip can significantly reduce storage costs and improve query performance compared to storing unpartitioned and uncompressed data. A query to analyze daily user activity will only need to scan the relevant daily partition, while compression will reduce the size of each partition.
This approach leverages the cost-effectiveness of S3 while still maintaining good performance.
Efficient Data Retrieval Methods
Efficient data retrieval is paramount for serverless analytics performance. The choice of data retrieval method depends on the data source and the specific analytical requirements. Optimizing retrieval involves minimizing latency and maximizing throughput.
- Object Storage (e.g., AWS S3, Google Cloud Storage): Object storage is a cost-effective and scalable option for storing large datasets. Retrieval methods often involve:
- Direct Object Access: Serverless functions can directly access objects in storage using the cloud provider’s SDKs. This is suitable for batch processing and large-scale data analysis.
- Data Lake Frameworks: Frameworks like Apache Spark can read data directly from object storage, enabling distributed processing and parallel data retrieval.
- Query Acceleration: Some object storage services offer query acceleration features (e.g., AWS S3 Select, Google Cloud Storage Object Data Access), allowing serverless functions to filter and retrieve only the necessary data, reducing the amount of data transferred.
- Databases (e.g., Amazon Aurora, Google Cloud SQL): Databases provide structured data storage and efficient query capabilities. Retrieval methods typically involve:
- SQL Queries: Serverless functions can execute SQL queries to retrieve specific data from the database. Optimizing SQL queries (e.g., using indexes, avoiding full table scans) is crucial for performance.
- Caching: Implementing caching mechanisms (e.g., using Redis or Memcached) can reduce database load and improve query response times by storing frequently accessed data in memory.
- Connection Pooling: Managing database connections efficiently using connection pooling can minimize the overhead of establishing and closing connections, especially for high-volume workloads.
- Data Warehouses (e.g., Amazon Redshift, Google BigQuery): Data warehouses are designed for analytical workloads and offer optimized query performance. Retrieval methods typically involve:
- SQL Queries: Data warehouses support SQL queries, optimized for complex analytical operations.
- Columnar Storage: Data warehouses often use columnar storage formats, which are highly efficient for analytical queries that only access a subset of columns.
- Query Optimization: Data warehouses employ query optimizers that analyze queries and determine the most efficient execution plan.
Data Storage Options for Analytics: Pros and Cons
The following table provides an overview of the pros and cons of different data storage options for analytics, with a focus on their suitability for serverless environments.
| Storage Option | Pros | Cons | Considerations for Serverless |
|---|---|---|---|
| Object Storage (e.g., S3, GCS) |
|
|
|
| Databases (e.g., Aurora, Cloud SQL) |
|
|
|
| Data Warehouses (e.g., Redshift, BigQuery) |
|
|
|
| NoSQL Databases (e.g., DynamoDB, Firestore) |
|
|
|
Code Optimization Techniques
Optimizing code within serverless functions is crucial for achieving high performance and cost efficiency in serverless analytics. Efficient code directly translates to faster execution times, reduced resource consumption, and ultimately, lower operational expenses. This section delves into specific strategies and techniques to enhance the performance of serverless function code.
Best Practices for Efficient Serverless Functions
Writing efficient serverless functions requires adherence to several best practices, focusing on code structure, dependency management, and resource utilization. Implementing these practices significantly improves function performance and scalability.
- Code Modularity: Breaking down complex functions into smaller, reusable modules is fundamental. This promotes code reusability, maintainability, and testability. Modular code allows for easier debugging and faster development cycles. Consider the Single Responsibility Principle, where each module performs a specific task. For instance, instead of a single function handling data ingestion, transformation, and storage, create separate modules for each operation.
- Minimizing Dependencies: Reduce the number and size of external libraries and dependencies used by your functions. Each dependency increases the function’s deployment package size, leading to longer cold start times. Analyze dependencies to identify those that can be removed or replaced with more lightweight alternatives. Consider using native language features or built-in libraries whenever possible. Regularly review dependencies for updates and security vulnerabilities.
- Efficient Data Handling: Optimize data processing within the function. Avoid unnecessary data copying or transformations. Use efficient data structures and algorithms appropriate for the task. For example, when processing large datasets, consider using streaming techniques to process data in chunks rather than loading the entire dataset into memory.
- Error Handling and Logging: Implement robust error handling and logging mechanisms. Proper logging allows for quick identification and resolution of issues. Use structured logging to capture relevant information such as timestamps, function names, and error messages. Implement appropriate error handling strategies to gracefully handle exceptions and prevent function failures.
- Input Validation: Always validate input data to prevent unexpected behavior and potential security vulnerabilities. Ensure that the data conforms to the expected format and range. Input validation helps prevent errors and reduces the risk of malicious attacks.
Techniques for Optimizing Function Execution Time
Several techniques can be employed to directly impact function execution time, leading to improved performance. These techniques primarily focus on reducing latency and resource consumption.
- Caching: Implement caching mechanisms to store frequently accessed data or the results of expensive computations. Caching can significantly reduce execution time by avoiding redundant computations. Caching can be implemented at various levels, including:
- In-memory caching: Use local variables or in-memory data structures within the function to cache data. This is suitable for frequently accessed data that fits within the function’s memory limits.
- Distributed caching: Utilize external caching services like Redis or Memcached to store data accessible across multiple function invocations. This is suitable for larger datasets or data that needs to be shared between functions.
- Connection Pooling: Establish and reuse database connections instead of creating a new connection for each function invocation. Connection pooling reduces the overhead of establishing connections, which can be a significant bottleneck. Libraries or frameworks often provide connection pooling functionality.
- Lazy Loading: Load dependencies and resources only when they are needed. This reduces the initial startup time of the function. Lazy loading can be applied to both code and data.
- Concurrency: Utilize concurrency where possible to execute multiple tasks simultaneously within a function. This can be particularly effective for I/O-bound operations such as making network requests or interacting with databases. However, be mindful of resource limits and potential contention issues.
- Optimizing Language and Runtime: Choose the appropriate programming language and runtime environment for the serverless function. Some languages and runtimes offer better performance characteristics than others. For example, compiled languages often outperform interpreted languages in terms of execution speed. Profiling and benchmarking your code can help identify performance bottlenecks and guide the selection of the optimal language and runtime.
Code Examples of Performance Optimization Techniques (Python)
The following Python code examples demonstrate common performance optimization techniques within the context of serverless functions. These examples illustrate how to implement caching, connection pooling, and other strategies to improve execution time.
Example 1: Caching with `functools.lru_cache`
This example demonstrates the use of Python’s built-in `functools.lru_cache` decorator for in-memory caching. The decorator caches the results of a function based on its input arguments.
import functoolsimport [email protected]_cache(maxsize=128) # Cache up to 128 resultsdef expensive_computation(n): print(f"Performing expensive computation for n...") time.sleep(2) # Simulate a time-consuming operation return n- n# First call will execute the functionstart_time = time.time()result1 = expensive_computation(5)end_time = time.time()print(f"Result 1: result1, Time: end_time - start_time:.2f seconds")# Second call will retrieve the result from the cachestart_time = time.time()result2 = expensive_computation(5)end_time = time.time()print(f"Result 2: result2, Time: end_time - start_time:.2f seconds")# Another call with a different argumentstart_time = time.time()result3 = expensive_computation(10)end_time = time.time()print(f"Result 3: result3, Time: end_time - start_time:.2f seconds")In this example, the first call to `expensive_computation(5)` will execute the function and take approximately 2 seconds due to the `time.sleep(2)` call. The second call with the same input `expensive_computation(5)` will retrieve the result from the cache instantly, taking negligible time. The third call with a different input, `expensive_computation(10)`, will execute the function again, and this process will be repeated if there is no cache.
This illustrates how caching can significantly reduce execution time for functions that perform computationally expensive tasks or interact with external resources.
Example 2: Connection Pooling with a Database Library (Example with `psycopg2` for PostgreSQL)
This example illustrates connection pooling using the `psycopg2` library for PostgreSQL. Connection pooling reduces the overhead of establishing new database connections for each function invocation.
import psycopg2from psycopg2.pool import SimpleConnectionPoolimport os# Retrieve database credentials from environment variablesDB_HOST = os.environ.get("DB_HOST")DB_NAME = os.environ.get("DB_NAME")DB_USER = os.environ.get("DB_USER")DB_PASSWORD = os.environ.get("DB_PASSWORD")# Create a connection pooltry: connection_pool = SimpleConnectionPool( minconn=1, # Minimum number of connections in the pool maxconn=10, # Maximum number of connections in the pool host=DB_HOST, database=DB_NAME, user=DB_USER, password=DB_PASSWORD )except Exception as e: print(f"Error creating connection pool: e") connection_pool = Nonedef query_database(query): if connection_pool is None: print("Connection pool not initialized.") return None try: conn = connection_pool.getconn() # Get a connection from the pool cur = conn.cursor() cur.execute(query) result = cur.fetchall() cur.close() connection_pool.putconn(conn) # Return the connection to the pool return result except Exception as e: print(f"Error querying database: e") return None# Example usagequery = "SELECT- FROM my_table LIMIT 10;"results = query_database(query)if results: print(results)In this example, a connection pool is created using `psycopg2.pool.SimpleConnectionPool`. The function `query_database` retrieves a connection from the pool, executes the SQL query, and then returns the connection to the pool. This approach avoids the overhead of establishing a new database connection for each function invocation, improving performance. The `minconn` and `maxconn` parameters control the number of connections in the pool.
In a serverless environment, it’s crucial to handle connection pool initialization and management carefully to avoid connection leaks or excessive resource consumption.
Example 3: Lazy Loading
This example demonstrates the concept of lazy loading, where dependencies are loaded only when needed. This reduces the initial function startup time.
import osdef my_function(event, context): # Check if a specific environment variable is set if os.environ.get("FEATURE_FLAG") == "enabled": # Load the dependency only if the feature flag is enabled import expensive_library # Hypothetical expensive library result = expensive_library.do_something(event) else: result = "Feature disabled" return "statusCode": 200, "body": result In this example, the `expensive_library` is only imported if the environment variable `FEATURE_FLAG` is set to “enabled”. This avoids loading the library and its dependencies during the initial function startup if the feature is not enabled, leading to a faster cold start time. The use of environment variables allows for dynamic control over feature loading.
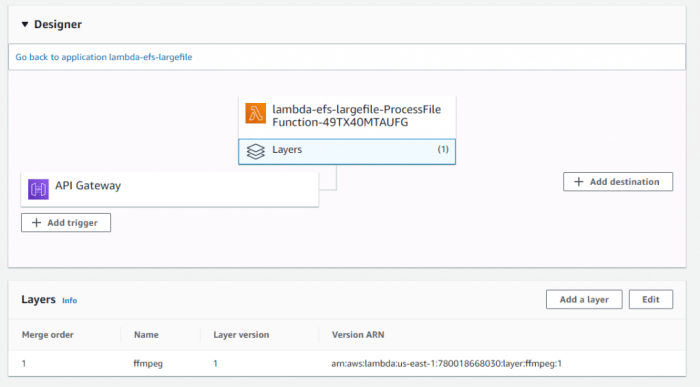
Event Trigger Optimization
Optimizing event triggers is critical for the performance and cost-effectiveness of serverless analytics pipelines. Event triggers, such as API Gateway invocations or message queue events, initiate the execution of serverless functions. Inefficiently configured triggers can lead to latency, increased costs, and missed data processing opportunities. This section details strategies for optimizing these triggers, especially in the face of bursty workloads, and preventing cold starts.
API Gateway Optimization
API Gateway serves as the entry point for many serverless analytics pipelines, handling incoming requests and routing them to the appropriate functions. Optimizing API Gateway configuration directly impacts performance and resource utilization.The following techniques can be applied to improve API Gateway performance:
- Caching: Implement API Gateway caching to store the responses of frequently accessed data. This reduces the load on backend functions and improves response times. For example, caching the results of a frequently queried dashboard metric can significantly reduce latency. The cache settings can be configured in the API Gateway console, specifying the cache TTL (Time To Live) and the size of the cache.
- Request Throttling: Configure throttling limits to prevent overload and ensure service availability. Throttling can be applied at different levels, such as per-API, per-method, or per-user, to manage the incoming request rate. The throttling configuration should be adjusted based on the expected load and the capacity of the backend functions. Consider the following formula:
Request Rate Limit = (Number of instances)
– (Requests per instance)For instance, if a function has 100 instances and each instance can handle 10 requests per second, the overall request rate limit should be set to 1000 requests per second to avoid throttling.
- Request Validation: Validate incoming requests to filter out invalid data early in the pipeline. This minimizes the processing of incorrect data by backend functions and prevents potential errors. API Gateway supports request validation based on schemas defined in the OpenAPI specification (formerly Swagger).
- Connection Pooling: If the backend functions interact with databases or other external services, utilize connection pooling to reuse connections. This reduces the overhead of establishing new connections for each request, thus improving performance.
- Compression: Enable compression (e.g., gzip) to reduce the size of the data transferred between the client and the API Gateway, especially for large payloads. This results in faster data transfer and improved user experience.
Message Queue Optimization
Message queues, such as Amazon SQS or Apache Kafka, are often used to decouple components in serverless analytics pipelines, allowing for asynchronous processing of events. Optimizing message queue usage is vital for efficient data ingestion and processing.Consider these points for optimal message queue configuration:
- Batch Processing: Configure functions to process messages in batches, rather than individually. Batch processing reduces the number of function invocations and can significantly improve throughput. The batch size can be adjusted based on the function’s processing capabilities and the size of the messages.
- Visibility Timeout: Set an appropriate visibility timeout for messages. The visibility timeout determines the amount of time a message is invisible to other consumers while being processed. This prevents messages from being processed multiple times in case of function failures. The visibility timeout should be longer than the expected processing time of a message.
- Dead-Letter Queues (DLQs): Implement DLQs to handle messages that cannot be processed successfully. DLQs provide a mechanism for retrying failed messages or investigating processing errors. Configure DLQs to receive messages that exceed the maximum receive count or fail to be processed by the consumer functions.
- Queue Capacity: Monitor the queue’s backlog and adjust the queue capacity (e.g., number of SQS queues) as needed to handle the incoming message rate. This ensures that messages are processed promptly and prevents delays.
- Message Deduplication: Implement message deduplication, particularly when handling events from external sources. Deduplication prevents duplicate processing of the same event, which is crucial for accurate analytics results. Implement a deduplication mechanism, such as a message ID or a content-based checksum.
Strategies for Handling Bursty Workloads and Preventing Cold Starts
Bursty workloads, characterized by sudden spikes in traffic, can challenge serverless analytics pipelines. The following techniques address bursty workloads and mitigate cold starts:
- Provisioned Concurrency: Use provisioned concurrency for functions that are critical to handle bursty traffic. Provisioned concurrency pre-warms the function instances, ensuring that they are immediately available to handle incoming requests. This minimizes the impact of cold starts and improves latency.
- Auto-Scaling: Configure auto-scaling for both the functions and the associated resources (e.g., message queue consumers). Auto-scaling dynamically adjusts the capacity of the resources based on the incoming workload, ensuring that the system can handle spikes in traffic. Set appropriate scaling policies based on metrics like invocation count, queue depth, and CPU utilization.
- Warm-Up Requests: Send periodic warm-up requests to the functions to keep them warm and prevent cold starts. Implement a health check endpoint that is regularly invoked to ensure the function instances remain active. This can be achieved using a scheduled event or a dedicated monitoring service.
- Event Source Mapping Optimization: For message queue-triggered functions, optimize the event source mapping configuration. Adjust the number of concurrent function invocations based on the message queue’s depth and the function’s processing capabilities.
- Asynchronous Invocation: Utilize asynchronous function invocations (e.g., using `InvokeAsync` in .NET) to decouple the request and response cycles. This allows the caller to quickly acknowledge the request and avoids blocking while the function executes.
Techniques for Effectively Managing Event Trigger Scaling
Scaling event triggers effectively is crucial for handling increasing workloads and maintaining performance. The following techniques are recommended:
- Horizontal Scaling: Implement horizontal scaling by increasing the number of function instances or consumers processing events from the trigger. This distributes the workload across multiple instances, thus improving overall throughput.
- Queue-Based Scaling: Leverage queue-based scaling to manage the workload. Monitor the queue depth and dynamically scale the number of consumers based on the backlog. This ensures that the system can handle peak loads without significant delays.
- Traffic Shaping: Use traffic shaping techniques, such as rate limiting and request throttling, to control the incoming traffic rate and prevent overload. This ensures that the system remains stable during periods of high load.
- Monitoring and Alerting: Implement comprehensive monitoring and alerting to track key performance indicators (KPIs) such as invocation latency, error rates, and queue depth. Set up alerts to notify the team when the performance degrades or when potential issues arise.
- Resource Allocation: Allocate sufficient resources to the functions and associated services. Monitor resource utilization and adjust the resource allocation as needed to ensure optimal performance.
Monitoring and Logging for Performance Tuning

Effective monitoring and logging are crucial for identifying and resolving performance bottlenecks in serverless analytics applications. By meticulously tracking key metrics and events, developers can gain deep insights into application behavior, enabling proactive optimization and ensuring efficient resource utilization. This proactive approach helps maintain optimal performance and cost-effectiveness.
Role of Monitoring and Logging in Identifying Performance Issues
Monitoring and logging provide the necessary visibility into serverless analytics applications to pinpoint performance issues. They enable a data-driven approach to troubleshooting, moving beyond guesswork to informed decision-making.
- Early Detection of Anomalies: Monitoring systems constantly assess application behavior, flagging deviations from established baselines. This early warning system alerts developers to potential problems before they significantly impact users. For example, a sudden spike in function invocation duration or an increase in error rates can indicate underlying issues, such as inefficient code or resource constraints.
- Pinpointing Bottlenecks: Detailed logs provide granular information about the execution of each function, including execution time, resource consumption, and dependencies. This information allows developers to identify specific areas where performance is lagging. For instance, slow database queries or inefficient data processing steps can be quickly identified by analyzing log data.
- Understanding Resource Utilization: Monitoring tools provide insights into resource consumption, such as CPU usage, memory allocation, and network traffic. By analyzing these metrics, developers can identify resource-intensive operations and optimize their code or adjust resource allocation accordingly. This is particularly important in serverless environments where resources are dynamically provisioned and charged based on usage.
- Performance Comparison and Trend Analysis: Monitoring and logging facilitate performance comparison over time. By tracking key metrics, developers can identify performance improvements or regressions following code changes or infrastructure updates. Trend analysis allows for the prediction of future performance based on historical data, enabling proactive scaling and optimization.
- Root Cause Analysis: Comprehensive logging, including detailed error messages and stack traces, aids in root cause analysis. When an error occurs, logs provide the context needed to understand the source of the problem, allowing developers to quickly diagnose and fix the issue.
Key Metrics to Monitor
A comprehensive monitoring strategy involves tracking a variety of metrics to gain a holistic view of application performance. The following are examples of critical metrics to monitor in serverless analytics:
- Function Duration: Measures the time it takes for a function to execute from start to finish. High function duration can indicate inefficient code, slow database queries, or other performance bottlenecks. Monitoring function duration helps identify and resolve these issues. For example, if a function’s average duration increases significantly after a code deployment, it suggests the new code introduced a performance regression.
- Memory Usage: Tracks the amount of memory consumed by a function during execution. Excessive memory usage can lead to performance degradation and increased costs. Monitoring memory usage helps identify memory leaks, inefficient data structures, and other memory-related issues. For instance, a function consistently exceeding its allocated memory limits will be terminated, resulting in failed invocations.
- Error Rates: Represents the percentage of function invocations that result in errors. High error rates indicate issues such as code bugs, infrastructure problems, or external service failures. Monitoring error rates is critical for identifying and resolving application failures. For example, a sudden increase in error rates after an API change might indicate compatibility issues.
- Invocation Count: Represents the number of times a function is invoked. Monitoring invocation count helps understand the workload and scale resources accordingly. Sudden spikes in invocation count may signal unexpected traffic, while consistently low invocation counts may indicate underutilization.
- Cold Starts: Measures the time it takes for a function to initialize when invoked for the first time or after a period of inactivity. Cold starts can introduce latency and impact user experience. Monitoring cold start times helps identify and mitigate their impact.
- Concurrency: Monitors the number of concurrent function executions. High concurrency can lead to resource contention and performance degradation. Monitoring concurrency helps ensure resources are allocated effectively.
- Data Processing Time: Measures the time it takes to process data within a function. This is crucial for data-intensive analytics applications. High data processing times may indicate inefficient algorithms or data transformations.
- External Service Latency: Tracks the time it takes to interact with external services such as databases, APIs, and object storage. High latency in external service interactions can significantly impact overall function performance.
Detailed Description of a Performance Dashboard
A well-designed performance dashboard provides a centralized view of critical metrics, enabling rapid identification of performance issues and informed decision-making. The dashboard should be intuitive, visually appealing, and easily accessible.
The following is a detailed description of a dashboard for monitoring serverless analytics performance:
Dashboard Layout:
- Header: The header contains the application name, date/time range selector, and links to other relevant dashboards (e.g., error logs, infrastructure monitoring).
- Key Metrics Section: This section displays the most critical metrics in large, easily readable formats. These metrics include:
- Average Function Duration (seconds): Displays the average execution time of all functions over the selected time range.
- Error Rate (%): Shows the percentage of function invocations that resulted in errors.
- Invocation Count: Displays the total number of function invocations.
- Average Memory Usage (MB): Shows the average memory consumed by functions.
- Function-Specific Metrics Section: This section provides detailed metrics for each function in the application. Each function has its own card or tile, displaying:
- Function Name: The name of the serverless function.
- Invocation Count: Total invocations for this specific function.
- Average Duration (seconds): Average execution time for this specific function.
- Error Rate (%): Error percentage for this specific function.
- Memory Usage (MB): Average memory usage for this specific function.
- Cold Start Count: Number of cold starts for this function.
- Trend Analysis Section: This section displays time-series graphs to visualize trends in key metrics over time. The graphs should include:
- Function Duration Trend: A line graph showing the average function duration over time.
- Error Rate Trend: A line graph showing the error rate over time.
- Invocation Count Trend: A line graph showing the invocation count over time.
- Memory Usage Trend: A line graph showing the average memory usage over time.
- Alerting Section: This section displays any active alerts and their status.
Data Visualization:
- Key Metrics: Use large, prominent numbers with color-coded indicators (e.g., green for good, yellow for warning, red for critical) to highlight the status of each key metric.
- Trend Graphs: Use line graphs to visualize time-series data. The graphs should have clear labels, axes, and legends. Use different colors for different metrics to make them easily distinguishable.
- Function-Specific Metrics: Display the data using a combination of numerical values, sparklines, and bar charts. Sparklines provide a quick visual overview of the function’s performance over time, while bar charts can be used to compare the performance of different functions.
- Error Distribution: Use a pie chart or bar chart to visualize the distribution of errors by type (e.g., timeout errors, database connection errors, API errors).
Dashboard Example:
Consider an example using a real-world scenario. An e-commerce company is running a serverless analytics application to process customer purchase data. The dashboard displays the following:
- Key Metrics: The “Average Function Duration” is displayed in a large green box, showing “0.8s” (indicating good performance). The “Error Rate” is displayed in a smaller red box, showing “3.5%” (indicating a potential issue).
- Function-Specific Metrics: A card for the “processOrder” function shows: “Invocation Count: 10,000”, “Average Duration: 1.2s”, “Error Rate: 5.0%”, and “Memory Usage: 256MB”.
- Trend Analysis: A line graph shows the “Average Function Duration” increasing slightly over the last hour, indicating a potential performance degradation. The “Error Rate” graph shows a spike in errors around 10:00 AM.
- Alerting: A warning message indicates that the “processOrder” function has exceeded its error rate threshold, and a detailed description is displayed.
This dashboard allows the operations team to quickly identify the “processOrder” function as a source of issues. They can investigate the function’s code, optimize database queries, or increase allocated memory to resolve the problem.
Scaling and Concurrency Management
Serverless analytics, by its very nature, demands robust scaling and concurrency management strategies. The unpredictable nature of analytical workloads, ranging from occasional batch processing to continuous real-time data streams, necessitates a system capable of dynamically adjusting its resources to meet fluctuating demands. Efficient scaling ensures optimal performance and cost-effectiveness, while proper concurrency control prevents resource exhaustion and maintains service availability.
Strategies for Automatic Scaling
Serverless platforms offer built-in autoscaling capabilities, triggered by various metrics reflecting workload intensity. The primary goal is to ensure the availability of sufficient compute resources to handle the incoming requests without introducing unnecessary delays or incurring excessive costs.
- Utilization-Based Scaling: This is the most common approach, where the serverless platform monitors the utilization of function instances, such as CPU usage, memory consumption, and request queue length. When the utilization exceeds a predefined threshold (e.g., CPU usage above 70%), the platform automatically provisions additional function instances. Conversely, if the utilization drops below a lower threshold for a sustained period, the platform scales down the number of instances to conserve resources.
For instance, a function processing financial transactions might experience a surge in requests during market opening hours, requiring autoscaling to accommodate the increased load. Conversely, during off-peak hours, the function can scale down, reducing operational costs.
- Concurrency-Based Scaling: Serverless platforms also track the number of concurrent function invocations. When the number of concurrent invocations approaches the configured concurrency limit, the platform automatically increases the number of function instances. This is particularly relevant for computationally intensive tasks or scenarios with high request rates. Consider an image processing function; if a large number of images are uploaded simultaneously, the platform will launch more instances to process them concurrently.
- Queue-Based Scaling: For asynchronous processing, where tasks are added to a queue (e.g., message queues like Amazon SQS or Azure Queue Storage), scaling can be driven by the queue depth. As the queue depth increases, indicating a backlog of unprocessed tasks, the platform automatically provisions more function instances to consume the tasks at a faster rate. An example of this could be a system processing sensor data, where the rate of data ingestion fluctuates.
If the queue accumulates a backlog of sensor readings, the function instances will scale to consume them.
- Custom Metrics-Based Scaling: In some cases, the built-in metrics might not fully capture the workload characteristics. Serverless platforms often allow users to define custom metrics (e.g., the number of items processed per second, the latency of a specific operation). Autoscaling policies can then be configured to respond to these custom metrics. For example, an e-commerce analytics function could track the number of orders processed and scale up or down based on this metric.
Methods for Managing Concurrency Limits
Concurrency limits are crucial for preventing resource exhaustion and ensuring the stability of serverless applications. These limits restrict the maximum number of concurrent function invocations, protecting the underlying infrastructure from being overwhelmed.
- Platform-Specific Limits: Serverless platforms impose default concurrency limits at the account, function, and region levels. These limits vary depending on the platform and the selected pricing plan. It’s essential to be aware of these limits and request increases if necessary. For instance, AWS Lambda has a default concurrency limit per region, which can be adjusted.
- Configuring Function Concurrency: Most platforms allow you to configure a reserved concurrency for individual functions. Reserved concurrency ensures that a specific number of function instances are always available to handle incoming requests, regardless of the overall account concurrency limit. This is useful for critical functions that require guaranteed resources.
- Monitoring Concurrency Metrics: Closely monitoring concurrency metrics, such as the number of concurrent executions and the number of throttled requests, is essential. These metrics provide insights into whether the configured concurrency limits are adequate. If the number of throttled requests is consistently high, it indicates that the concurrency limit is too low and needs to be increased.
- Circuit Breakers: Implementing circuit breakers can protect against cascading failures. If a function is experiencing issues (e.g., errors, high latency), a circuit breaker can temporarily prevent further invocations of that function, allowing it to recover without impacting other parts of the system.
- Throttling: Throttling is a technique to limit the rate at which requests are processed. This can be applied at the function level or using API gateway features. Throttling helps to prevent a function from being overwhelmed by excessive traffic and can be used to smooth out traffic spikes.
Autoscaling Illustration
The following diagram illustrates how function instances increase or decrease based on load. The x-axis represents time, and the y-axis represents the number of function instances. The load is represented by the dotted line.
Time (X-axis) | Number of Function Instances (Y-axis) | Load (Dotted Line) ----------------------------------------------------------------------------- 0:00 | 1 | Low 0:15 | 1 | Low 0:30 | 2 | Increasing 0:45 | 3 | High 1:00 | 4 | High 1:15 | 4 | High 1:30 | 3 | Decreasing 1:45 | 2 | Decreasing 2:00 | 1 | Low In this example, at the beginning, the system has one function instance. As the load (represented by the dotted line) increases, the autoscaling mechanism detects the increase and provisions more function instances to handle the load. The number of instances increases to four at the peak load. When the load decreases, the autoscaling mechanism scales down the number of function instances, eventually returning to one instance when the load is low.
This dynamic adjustment ensures that the system has the resources it needs while minimizing costs.
Cold Start Mitigation Strategies
Serverless functions, while offering scalability and cost-effectiveness, are susceptible to cold starts, a performance bottleneck that can significantly impact application responsiveness. Understanding the causes and implementing effective mitigation strategies is crucial for optimizing serverless analytics performance. Cold starts occur when a function is invoked after a period of inactivity, forcing the cloud provider to provision a new container instance to execute the code.
This provisioning process can introduce latency, affecting the user experience.
Causes of Cold Starts in Serverless Functions
Several factors contribute to cold starts in serverless environments. Recognizing these factors is essential for developing effective mitigation strategies.
- Function Inactivity: The primary trigger for a cold start is the absence of active function invocations. When a function has not been used for a certain duration (determined by the cloud provider), the underlying container instance is typically de-provisioned to conserve resources. Subsequent requests then necessitate the instantiation of a new container, leading to a cold start.
- Container Provisioning: The time required to provision a new container instance varies depending on the function’s configuration, the size of the deployed code, and the underlying infrastructure. This includes the time to download the code, initialize the runtime environment, and load any dependencies.
- Dependency Loading: Serverless functions often rely on external libraries and dependencies. The process of loading these dependencies during the container initialization phase contributes to the cold start duration. Large or numerous dependencies can significantly increase this loading time.
- Runtime Environment Initialization: The serverless runtime environment, such as Node.js or Python, needs to be initialized before the function code can execute. This initialization process, including setting up the environment variables and configuring the execution context, adds to the overall cold start time.
- Resource Allocation: The allocation of resources, such as CPU and memory, to the container instance also impacts cold start times. Insufficient resource allocation can slow down the initialization and execution of the function.
Techniques for Reducing Cold Start Times
Several techniques can be employed to mitigate cold start times, each with its own trade-offs. The choice of the most suitable technique depends on the specific application requirements and the acceptable level of latency.
- Provisioned Concurrency: Provisioned concurrency is a powerful technique that allows you to pre-initialize a specific number of function instances, ready to serve requests. This eliminates the need for a cold start because the instances are already running. The cloud provider maintains these pre-warmed instances, ready to handle incoming traffic. Provisioned concurrency incurs a cost based on the number of provisioned instances and the duration they are active.
This technique is most effective when the traffic pattern is predictable.
- Keep-Alive Connections: Keep-alive connections, or connection pooling, involve maintaining persistent connections to external resources, such as databases or other services. By reusing existing connections, the overhead of establishing new connections for each function invocation is reduced, thereby improving performance and potentially reducing cold start times. This is particularly beneficial when interacting with services that require significant connection setup time.
- Code Optimization: Optimizing the function’s code can also contribute to faster cold starts. This includes minimizing the size of the deployment package, reducing the number of dependencies, and optimizing the initialization process. Removing unnecessary code and optimizing the execution path can reduce the time it takes for the function to start.
- Memory Optimization: Allocating the appropriate memory to the function can improve cold start times. Insufficient memory can lead to slow initialization and execution. Conversely, over-allocating memory can increase costs without providing significant performance benefits.
- Reduce Dependencies: Minimize the number and size of dependencies included in the function’s deployment package. Each dependency requires time to download and load during the cold start process. Consider using lightweight libraries or techniques like code splitting to reduce the overall package size.
- Warm-up Requests: Periodically invoking the function, even with dummy requests, can help keep the function instance warm and prevent cold starts. This can be achieved through scheduled events or monitoring services that trigger the function at regular intervals.
- Use Faster Runtimes: Choosing a runtime environment known for its faster startup times can also help reduce cold start durations. For example, some runtimes may have more efficient initialization processes than others.
Approaches to Minimize Cold Start Impact and their Trade-offs:
- Provisioned Concurrency: Offers the best performance by eliminating cold starts. The trade-off is increased cost due to the pre-warmed instances.
- Keep-Alive Connections: Improves connection performance, potentially reducing overall latency. The trade-off is that it requires connection management and may not fully eliminate cold starts.
- Code Optimization: Reduces cold start times by optimizing function initialization and execution. The trade-off is the development effort required for code refactoring.
- Warm-up Requests: Keeps functions warm by triggering them periodically. The trade-off is the cost of the warm-up requests and the potential for increased resource consumption.
Cost Optimization Strategies

Serverless analytics, while offering significant benefits in scalability and agility, can introduce cost complexities if not managed effectively. Understanding and implementing cost optimization strategies are crucial to ensure that serverless analytics workloads remain economically viable. This involves a multi-faceted approach, encompassing resource allocation, code efficiency, and strategic service selection.
Right-Sizing Resources
Optimizing resource allocation is a fundamental step in controlling serverless analytics costs. This process involves carefully matching the compute, memory, and storage resources to the actual demands of the workload. Over-provisioning leads to unnecessary expenses, while under-provisioning can result in performance bottlenecks and, indirectly, higher costs due to increased execution times.
- Function Memory Allocation: Serverless functions, such as those in AWS Lambda or Azure Functions, have configurable memory settings. Selecting the appropriate memory allocation directly impacts the CPU power available to the function. Allocating too much memory increases cost, while too little can lead to longer execution times and potentially increased invocations. Monitor function performance metrics, such as execution duration and memory utilization, to determine the optimal memory setting.
- Compute Instance Selection: For services like AWS Glue or Azure Data Factory, which utilize underlying compute instances, choosing the correct instance type is essential. These services often offer various instance sizes, each with different CPU, memory, and storage capabilities. Evaluate the workload’s processing requirements, considering factors like data volume, complexity of transformations, and concurrency needs, to select the most cost-effective instance type.
- Storage Optimization: Serverless analytics often involves storing large datasets. Optimize storage costs by selecting appropriate storage tiers. For example, AWS S3 offers different storage classes (Standard, Intelligent-Tiering, Glacier) with varying costs and access frequencies. Consider the access patterns of your data to determine the most cost-effective storage class. For infrequently accessed data, archival storage like Glacier can significantly reduce storage costs.
Optimizing Function Memory
The memory allocated to a serverless function is a critical factor in its performance and cost. Memory directly influences the CPU resources available to the function, impacting execution time and the overall cost of the function invocation. Finding the optimal memory setting is a balance between performance and cost.
- Monitoring Memory Utilization: Continuously monitor the memory utilization of serverless functions. Cloud providers typically offer monitoring tools that track the peak memory usage during function execution. If the function consistently uses less than the allocated memory, consider reducing the memory allocation.
- Profiling Code: Use profiling tools to identify memory-intensive operations within the function code. Optimizing these operations, such as reducing the size of data structures or improving data processing algorithms, can reduce memory consumption and allow for a lower memory allocation.
- Benchmarking Performance: Conduct benchmark tests with different memory settings to evaluate the impact on execution time. Create a performance curve, plotting execution time against memory allocation. Identify the point where increasing memory provides diminishing returns in terms of performance improvement. This point represents the optimal memory setting for the function.
Cost-Saving Best Practices
Implementing specific best practices can significantly contribute to reducing the cost of serverless analytics workloads. These practices involve a combination of architectural choices, code optimization, and efficient resource utilization.
- Use Serverless Services Strategically: Select serverless services that are specifically designed for the task at hand. For example, use AWS Athena for querying data stored in S3 instead of deploying a full-fledged database instance.
- Optimize Data Transfer: Minimize data transfer costs by keeping data within the same region. If data needs to be transferred between regions, consider using data compression techniques to reduce the data volume.
- Implement Auto-Scaling: Configure auto-scaling for serverless services to automatically adjust resources based on demand. This ensures that resources are only provisioned when needed, minimizing idle time and associated costs.
- Batch Processing: Process data in batches whenever possible. This reduces the number of function invocations and associated costs. For example, instead of processing individual events, aggregate them into batches and process the batch with a single function invocation.
- Caching Strategies: Implement caching mechanisms to reduce the need to repeatedly compute or retrieve data. Caching can be implemented at various levels, from in-memory caching within functions to using dedicated caching services like Amazon ElastiCache or Azure Cache for Redis.
- Regular Cost Analysis: Conduct regular cost analysis to identify areas where costs can be further reduced. Use cloud provider cost management tools to track spending, set budgets, and identify cost anomalies.
Comparative Analysis of Pricing Models
Different serverless services employ various pricing models. Understanding these models is essential for making informed decisions about service selection and cost optimization. The following table presents a comparative analysis of common pricing models.
| Pricing Model | Description | Advantages | Disadvantages |
|---|---|---|---|
| Pay-per-Use (e.g., AWS Lambda, Azure Functions) | You pay only for the resources consumed during function execution, including compute time, memory allocation, and the number of invocations. | Highly cost-effective for sporadic workloads, no upfront costs, scales automatically. | Can be unpredictable for workloads with highly variable traffic, requires careful monitoring and optimization to avoid unexpected costs. |
| Provisioned Concurrency (e.g., AWS Lambda) | You pay for a fixed amount of pre-warmed compute capacity that is always available. | Provides predictable performance, reduces cold start latency, ideal for latency-sensitive applications. | Higher cost compared to pay-per-use, may lead to over-provisioning if concurrency is not fully utilized. |
| Consumption-Based (e.g., AWS S3, Azure Blob Storage) | You pay based on the amount of storage used and the number of requests made to the storage service. | Simple and scalable, cost-effective for storing large amounts of data, pay only for what you use. | Cost can increase significantly with high data access frequency or large data volumes. |
| Fixed Cost (e.g., Reserved Instances, Dedicated Compute) | You pay a fixed price for a dedicated amount of compute resources for a specific duration. | Provides cost predictability, suitable for stable workloads with predictable resource requirements. | Requires upfront commitment, less flexible than pay-per-use, may result in under-utilization of resources. |
Security Considerations and Performance
Serverless analytics, while offering significant advantages in scalability and cost-efficiency, introduces unique security challenges that can impact performance. Implementing robust security measures is crucial to protect sensitive data and prevent unauthorized access. However, poorly implemented security practices can introduce performance bottlenecks, increasing latency and resource consumption. A careful balance must be struck to ensure a secure and performant serverless analytics pipeline.
Impact of Security Measures on Serverless Analytics Performance
The addition of security features, while essential, inevitably introduces overhead. This overhead can manifest in several ways, directly impacting performance metrics such as latency and throughput.
- Authentication and Authorization: Implementing robust authentication and authorization mechanisms, such as multi-factor authentication (MFA) and fine-grained access control, adds processing time. Each request needs to be validated against identity providers, access policies, and permissions, which can increase the overall execution time of serverless functions. For instance, the overhead associated with verifying JWT tokens can vary depending on the complexity of the claims and the signing algorithm used.
A more complex algorithm, while providing stronger security, will naturally take longer to verify.
- Encryption and Decryption: Data encryption, both at rest and in transit, is critical for protecting sensitive information. However, encryption and decryption processes consume CPU cycles and can increase the time required to process data. The choice of encryption algorithm (e.g., AES, RSA) and key management practices significantly impact performance. For example, encrypting large datasets using a computationally expensive algorithm can substantially increase the latency of data processing tasks.
- Network Security: Security measures like firewalls, intrusion detection systems (IDS), and virtual private networks (VPNs) add network latency. These measures inspect and filter network traffic, which can introduce delays in data transfer and communication between serverless functions and other services. The complexity of network security rules and the volume of traffic being monitored directly influence the performance impact.
- Input Validation and Sanitization: Validating and sanitizing user inputs is crucial to prevent security vulnerabilities like SQL injection and cross-site scripting (XSS) attacks. However, these processes add processing time to each request. The complexity of input validation rules and the volume of data being validated directly influence performance. For instance, complex regular expressions used for input validation can consume significant CPU resources, especially when handling large input strings.
- Logging and Auditing: Comprehensive logging and auditing are essential for security monitoring and incident response. However, excessive logging can increase storage costs and impact performance. Writing logs to a centralized logging system, such as Amazon CloudWatch Logs or Azure Monitor, can introduce latency, especially during peak traffic periods.
Balancing Security Requirements with Performance Optimization
Achieving a balance between security and performance requires a strategic approach. This involves carefully selecting security measures, optimizing their implementation, and continuously monitoring their impact.
- Prioritize Security Controls: Implement security measures based on the sensitivity of the data and the potential threats. Not all data requires the same level of protection. Prioritize the implementation of security controls that provide the most significant security benefits with the least performance impact.
- Optimize Authentication and Authorization: Leverage managed identity providers, such as AWS Cognito, Azure Active Directory, or Google Cloud Identity Platform, to offload the burden of authentication and authorization. These services are designed for scalability and can minimize the performance impact. Use access control lists (ACLs) and role-based access control (RBAC) to manage permissions efficiently.
- Choose Efficient Encryption Algorithms: Select encryption algorithms that provide strong security with minimal performance overhead. Consider using hardware security modules (HSMs) or key management services (KMS) to offload encryption and decryption tasks. For instance, AES-256 is a widely used and secure algorithm.
- Optimize Network Security: Configure network security measures to minimize latency. Use Content Delivery Networks (CDNs) to cache static content closer to users, reducing the load on the serverless functions. Optimize firewall rules and intrusion detection systems to reduce false positives and minimize traffic inspection overhead.
- Optimize Input Validation and Sanitization: Implement input validation and sanitization techniques that are efficient and effective. Use libraries and frameworks that are optimized for performance. Validate inputs at the earliest possible stage of the processing pipeline. Consider using a schema validation tool to enforce data structure and prevent malformed inputs.
- Optimize Logging and Auditing: Configure logging levels to capture the necessary information without excessive verbosity. Use asynchronous logging to avoid blocking the execution of serverless functions. Implement log aggregation and analysis tools to efficiently process and analyze logs. Consider sampling logs to reduce the volume of data generated.
- Regularly Monitor and Test: Continuously monitor the performance impact of security measures. Conduct penetration testing and security audits to identify vulnerabilities and optimize security configurations. Regularly review and update security policies and procedures.
Designing a Secure Serverless Analytics Pipeline While Minimizing Performance Overhead
Designing a secure and performant serverless analytics pipeline involves adopting a holistic approach that considers security at every stage of the pipeline.
- Data Encryption: Encrypt data at rest using KMS or a similar service, leveraging managed key rotation. Implement HTTPS for all data in transit. Consider using envelope encryption, encrypting the data with a data encryption key (DEK) and then encrypting the DEK with a key encryption key (KEK) managed by KMS.
- Access Control: Implement RBAC using IAM roles or similar services. Grant the least privilege necessary to each function. Use service accounts for communication between services, limiting their permissions to the minimum required.
- Input Validation and Sanitization: Use a web application firewall (WAF) to protect against common web vulnerabilities, such as SQL injection and cross-site scripting (XSS) attacks. Validate all user inputs, and sanitize data before processing.
- Event Trigger Security: Securely configure event triggers, such as those from Amazon S3 or Azure Blob Storage. Verify the origin of the events. Use event filtering to process only relevant events.
- Monitoring and Logging: Implement comprehensive logging and monitoring to detect security incidents and performance bottlenecks. Integrate logging with a security information and event management (SIEM) system for centralized security analysis.
- Network Security: Use VPCs to isolate serverless functions from the public internet. Use security groups to control inbound and outbound traffic. Consider using a VPN or private endpoints for accessing sensitive resources.
- Regular Security Audits: Conduct regular security audits and penetration testing to identify and address vulnerabilities. Implement automated security scans to identify misconfigurations and security threats.
- Example: Real-World Case Consider a company analyzing customer purchase data. To ensure data security and compliance with regulations like GDPR, they might implement the following:
- Encryption: Encrypt customer data at rest using AES-256 and in transit using TLS 1.3.
- Access Control: Use IAM roles with least privilege to restrict access to data based on user roles (e.g., analysts, data scientists).
- Input Validation: Employ a WAF to protect against common web vulnerabilities in any web applications or APIs.
- Monitoring: Implement CloudWatch metrics and alerts to detect anomalies, such as unusually high data access or unauthorized login attempts.
This layered approach helps the company balance data security and analytical performance.
Final Wrap-Up
In conclusion, mastering performance optimization in serverless analytics is crucial for unlocking its full potential. By carefully considering architectural choices, data handling strategies, code efficiency, and monitoring practices, you can build analytics pipelines that are not only highly performant but also cost-effective and scalable. The strategies discussed here provide a solid foundation for creating data-driven solutions that deliver valuable insights with speed and efficiency, ultimately transforming raw data into actionable intelligence.
Frequently Asked Questions
What is the impact of cold starts on serverless analytics performance?
Cold starts, the delay experienced when a serverless function instance is initiated, can significantly impact performance, particularly for latency-sensitive analytics tasks. Frequent cold starts can lead to inconsistent response times and reduced overall throughput, affecting user experience and potentially increasing costs.
How can I monitor the performance of my serverless analytics functions?
Effective monitoring involves tracking key metrics such as function duration, memory usage, error rates, and invocation counts. Utilize cloud provider-specific monitoring tools (e.g., CloudWatch, Azure Monitor, Cloud Logging) and consider implementing custom metrics to gain deeper insights into your function’s behavior and identify performance bottlenecks.
What are the key considerations when choosing a serverless platform for analytics?
Factors to consider include the platform’s compute options, pricing model, data storage integration, supported programming languages, and available monitoring and logging tools. Assess your specific performance needs, data processing requirements, and cost constraints to select the platform that best aligns with your analytics goals.
How does data partitioning improve serverless analytics performance?
Data partitioning divides large datasets into smaller, more manageable chunks, enabling parallel processing and reducing the amount of data each function needs to access. This can significantly improve query performance and reduce overall processing time, particularly in scenarios involving complex data transformations or aggregations.